48.7% of fire code complaints precede a structure fire within 30 days. Your underwriters don’t know this.
MARC-MK correlates 311 complaints, weather, and fire dispatch data to identify properties at elevated fire risk — weeks before incidents occur. Built on 41,646 real incidents across 95 fire stations.
Your fire risk models are blind to signals hiding in plain sight.
311 complaints, weather patterns, and real-time dispatch data exist in silos. Nobody has connected them to fire risk pricing — until now.
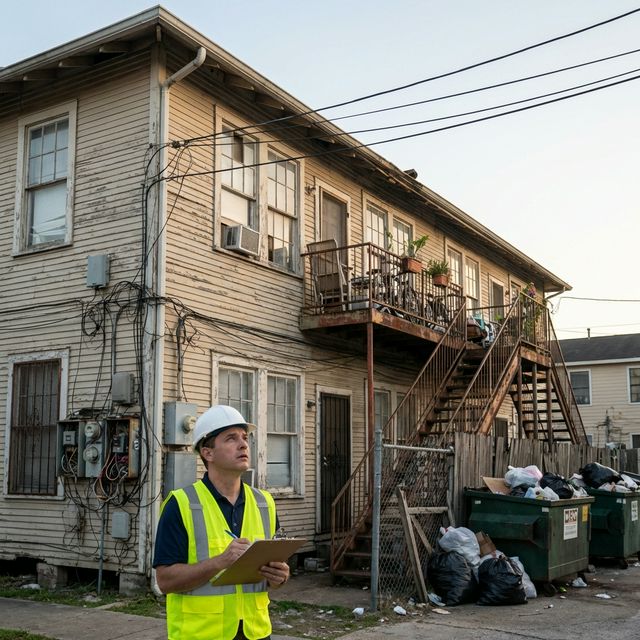
311 complaints are the canary in the coal mine.
Nearly half of fire code complaints in Houston precede a structure fire in the same area within 30 days — with an average 13-day warning window. That’s not historical noise. It’s a leading indicator happening in real time.
For underwriters, this is the difference between pricing based on 10-year historical loss data vs. pricing based on what’s happening this week.
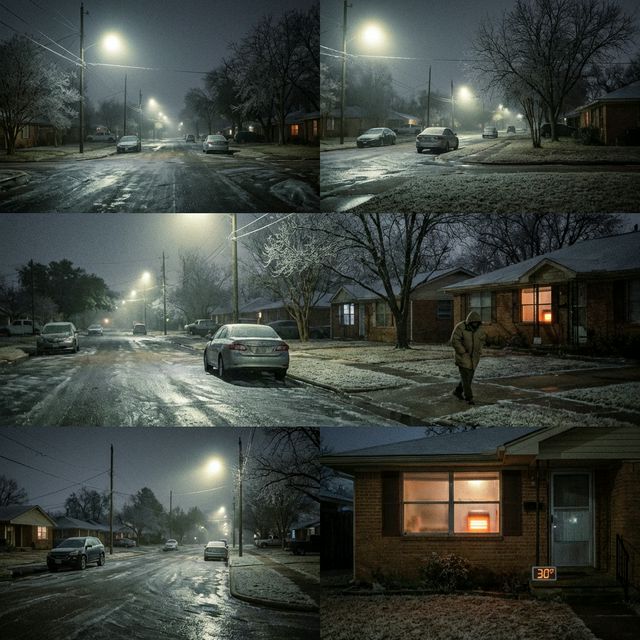
Cold weather is a pricing signal nobody’s using.
When temperatures drop below 45°F, structure fires spike 1.9x. January 24: temperature dropped 14.1°F, fires spiked 1,050%. The correlation (r=-0.61) is statistically significant and entirely predictable days in advance via NOAA forecasts.
Price fire risk on what’s happening this week — not last decade.
For alternative data teams and catastrophe modeling groups, this is a genuinely novel signal no competitor offers. No IT transformation required — just a data feed.
- 311 complaints predict fires with 48.7% accuracy and 13-day lead time
- Zip-code-level scoring combines station workload, complaints, and weather
- Weather-fire correlation (r = -0.61) provides real-time risk multipliers
- Data licensing — no IT transformation, just a feed
“Your 77007 properties have a 12.3% fire rate — 2x citywide average. Here’s why, and here’s what’s coming next week.”
9515 Cullen Blvd — four warnings, two fires.
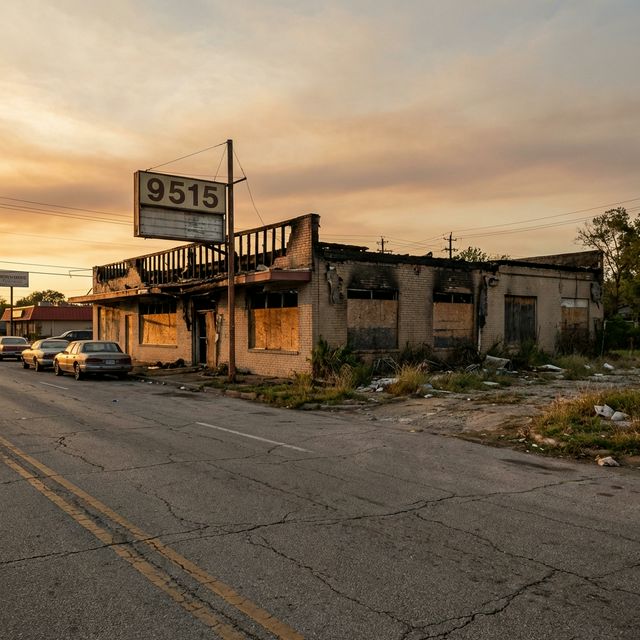
This is what a predictable fire looks like.
January 6: Building Code Violation (311). Same day: Multifamily Habitability Violation. January 14: Fire Code Complaint. January 20: Second Fire Code Complaint.
January 26: Apartment fire — Cullen Blvd / Sunbeam. February 1: Second apartment fire — same location.
Four warnings. Two fires. Same street. 6-26 days of lead time. This pattern repeats at 48.7% of fire code complaint locations across Houston.
From raw data to predictive intelligence in four layers.

Multi-Source Ingestion
Fire/EMS dispatch, 311 complaints, NOAA weather, and station records fused into one layer.

Fire Risk Scoring
Zip-code-level fire risk. Complaint-to-fire correlation. Weather-fire multipliers.

Portfolio Overlay
Your book mapped against risk zones, complaint hotspots, and seasonal risk windows.
Data Feed
API or scheduled delivery. No IT transformation. CSV, JSON, or dashboard access.
Built on real Houston data. Verified. Production-ready.
Built by operators, not consultants.
Navy Veteran Leadership
Founded by Robert Moeller, a Navy veteran with deep experience in federal procurement, AI/ML development, and operational intelligence. SDVOSB certified.
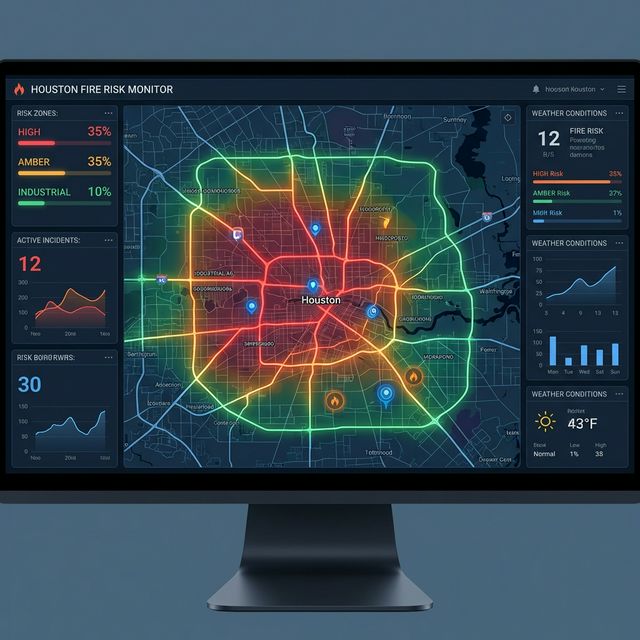
Production — Not a Pitch Deck
The Houston City Intelligence Dashboard is live and processing real data. Every number comes from verified incident data across 95 fire stations.
Defense-Grade AI Platform
MARC-MK powers Satori Defense’s federal programs including tactical training analytics for U.S. Customs and Border Protection.
We’ll load your neighborhoods into the live platform. 15 minutes. If the data doesn’t speak for itself, no follow-up needed.
- Your specific zip codes scored on fire risk
- Complaint-to-fire prediction for your portfolio
- Weather-fire multiplier modeling
- 15 minutes — no slides, no pitch, just data
- Direct conversation with CEO Robert Moeller
We respond within 24 hours with a personalized demo showing your area.