Rail blockages add 3.8 minutes to emergency response times. In cardiac arrest, that’s a 26-38% reduction in survival.
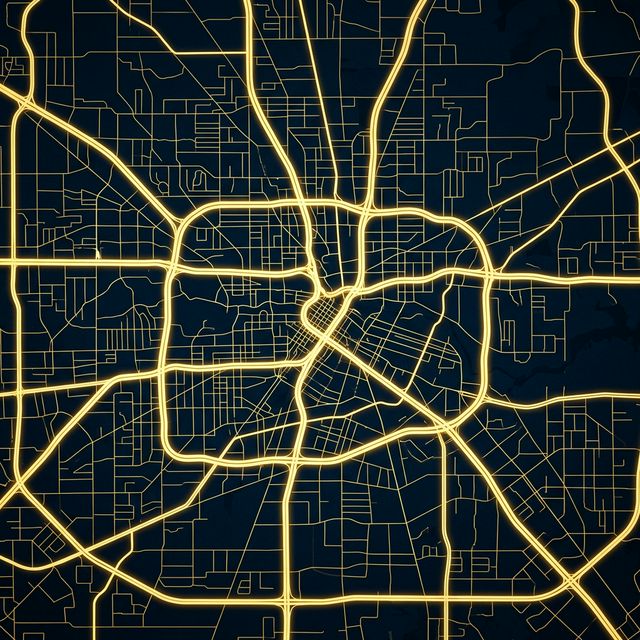
MARC-MK maps every rail crossing that intersects emergency response zones, predicts blockages, and routes around them before your units leave the station. Built on 41,646 real incidents across 95 stations in Houston.
Your response times have a hidden variable — and it’s entirely predictable.
Rail blockages and weather surges degrade critical care outcomes. Every minute of delay in cardiac arrest reduces survival by 7-10%. That’s not acceptable.
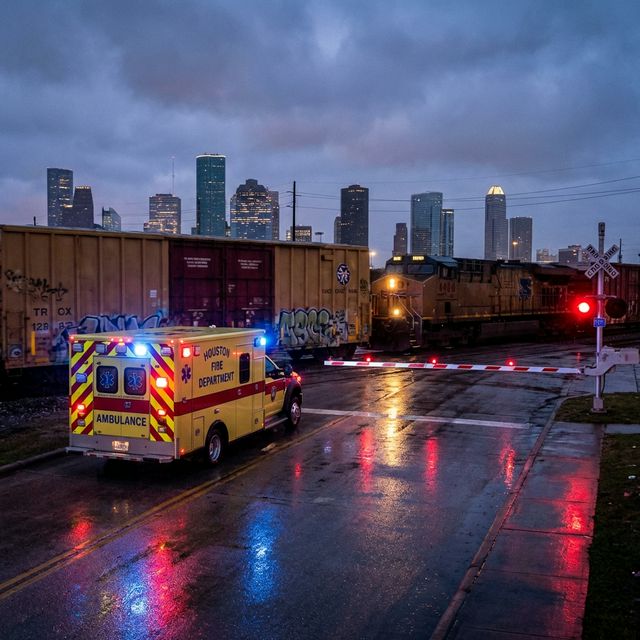
When the crossing is blocked, your patient waits.
Station 34 (3100 Laura Koppe) has 4 rail crossings in its response zone. BNSF and UP lines. Peak blockage: 2-4 PM. During active blockage, response delayed ~4.2 min. Every minute of delay in cardiac arrest reduces survival by 7-10%.
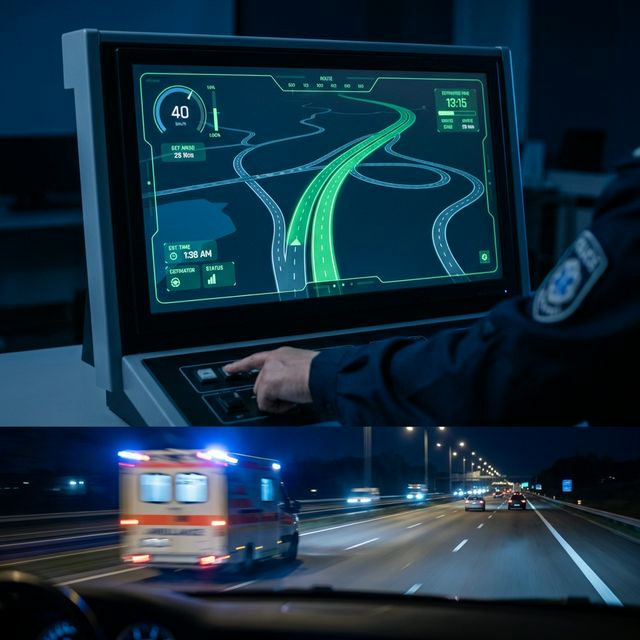
Nobody predicts when these blockages happen. Everyone reacts after they’re stuck. MARC-MK changes that by predicting blockage windows 30 minutes before they occur and routing around them automatically. Your units leave the station on the fastest path before you even know the crossing is blocked.
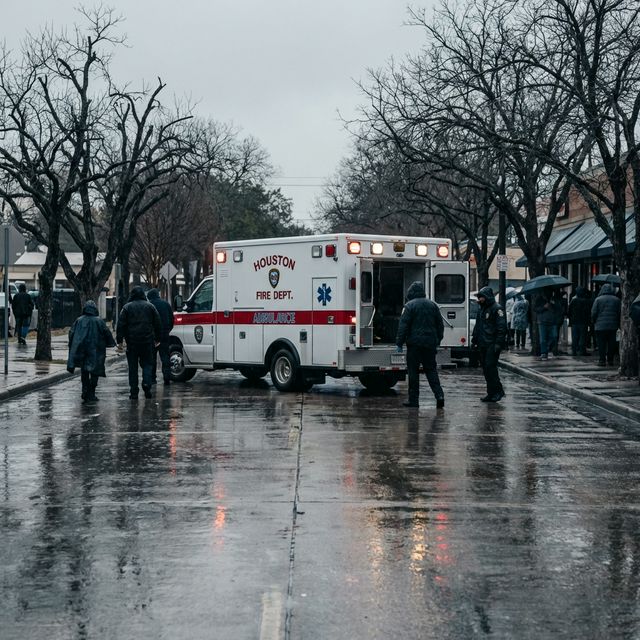
Cold weather creates a perfect storm for EMS.
When temperatures drop below 45°F, fire calls spike 75% (33/day vs 18.9). EMS is 92% of all 41,646 incidents. Weather is predictable days in advance. When the cold front hits Tuesday, your fleet is already stretched thin by Wednesday morning.
Station 33 handles 1,530 incidents. Station 14 handles a fraction. Pre-positioning based on predicted demand changes outcomes. MARC-MK correlates NOAA weather forecasts with historical incident patterns to deploy additional resources before the surge hits—not during it.
Predictive routing that accounts for the variables your dispatch system ignores.
- Real-time blockage routing for every rail crossing in your response zone
- Weather-correlated demand forecasting — deploy before the surge
- 139x workload differential analytics for resource pre-positioning
- Scenario library: "If BNSF blocked at 2:30 PM, Station 34 +4.2min, alternate I-610 to Bellaire"
“Your neonatal unit left station at 2:15 PM. BNSF was blocked. That’s 4.2 extra minutes to get to the hospital. With MARC-MK, they would have routed via I-610 to Bellaire instead.”
Station 34: Where every minute counts.
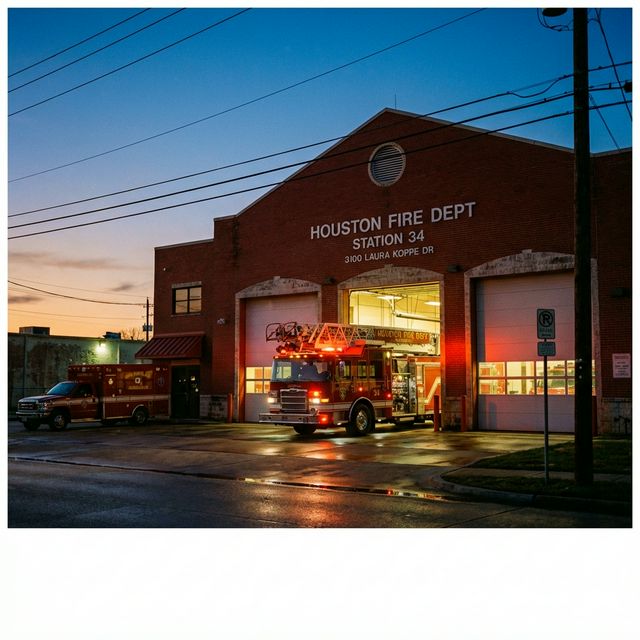
Neonatal transport. 4 rail crossings. One window.
Station 34 sits at 3100 Laura Koppe with 4 rail crossings in its response zone: BNSF Galveston Subdivision and UP lines cross the primary routes to the regional neonatal intensive care unit. Peak blockage window: 2-4 PM.
A neonatal transport call comes in at 2:15 PM during active BNSF blockage. Standard dispatch routing adds 4.2 minutes. For a premature infant requiring immediate transport, that delay pushes arrival outside the golden window for critical interventions. With MARC-MK, dispatch would have automatically routed via I-610 to Bellaire—avoiding the blockage entirely and saving 4.2 minutes that matter for survival.
From raw data to predictive intelligence in four layers.

Multi-Source Ingestion
Fire/EMS dispatch, rail data, weather, and station records fused into one unified layer.

Response Modeling
Predict delays, demand surges, and coverage gaps before they occur.
Route Intelligence
Alternate routes computed for every blocked scenario in every response zone.
Operational Output
Alerts, re-routing, and pre-positioning recommendations delivered in real time.
Built on real Houston data. Verified. Production-ready.
Built by operators, not consultants.
Navy Veteran Leadership
Founded by Robert Moeller, a Navy veteran with deep experience in federal procurement, AI/ML development, and operational intelligence. SDVOSB certified.
Production — Not a Pitch Deck
The Houston City Intelligence Dashboard is live and processing real data. Every number comes from verified incident data across 95 fire stations and 41,646 verified incidents.
Defense-Grade AI Platform
MARC-MK powers Satori Defense’s federal programs including tactical training analytics for U.S. Customs and Border Protection and emergency response optimization.
We’ll map your service area against our rail corridor data. 15 minutes. See where your response times are at risk.
Load your dispatch zones, station locations, and specialty transport routes. We show you exactly which crossings are in your response zones, which ones are blocked most frequently, and where pre-positioning could save lives.
- Your dispatch zones and station response areas mapped
- Rail corridor blockage predictions overlaid on your zones
- Alternate route recommendations with estimated delays
- Workload analysis across your operating stations
- 15 minutes — no pitch, just your data
We respond within 24 hours with your personalized response zone map.